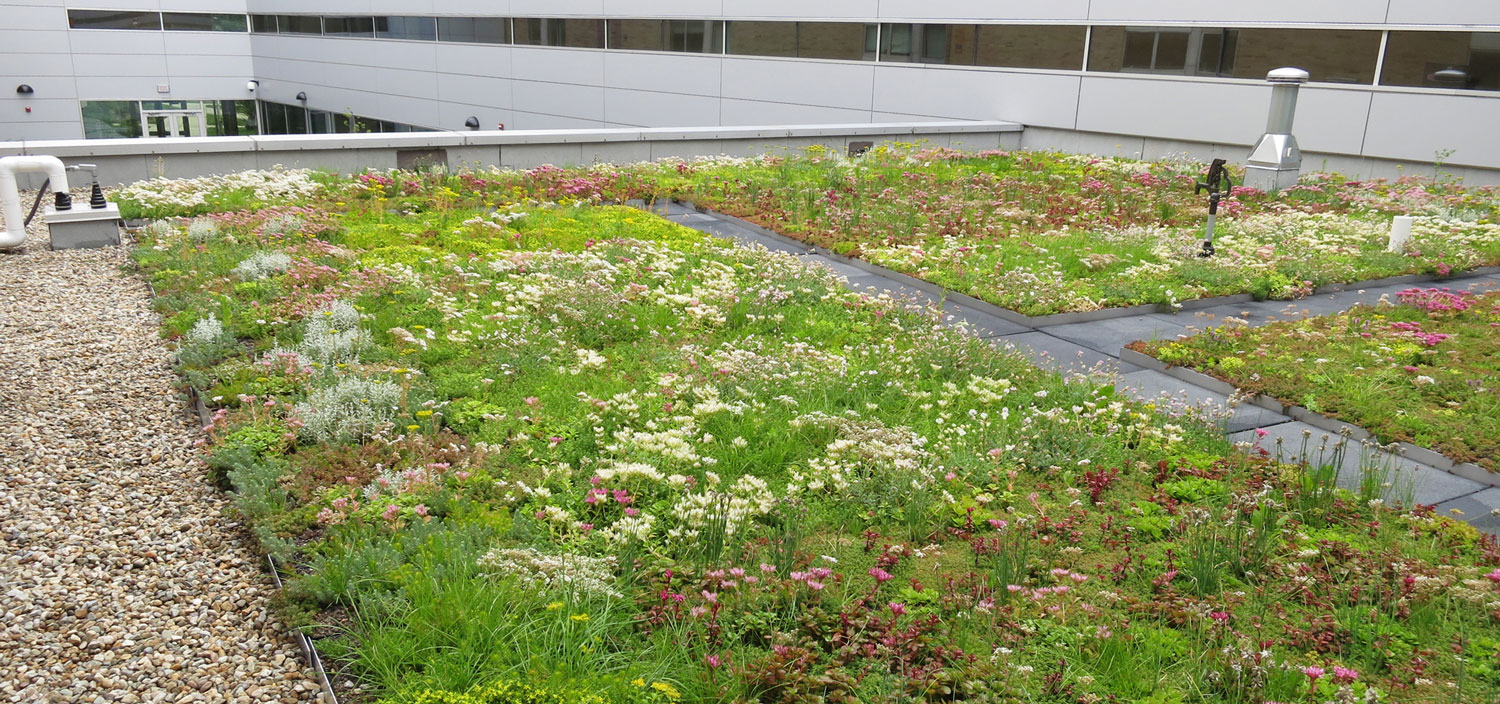
Rain is not pure water. By the time a raindrop reaches McKinley's roof, it has already been traveling through Buffalo's air — scrubbing up nitrogen oxides from vehicle exhaust, dust particles, and other pollutants. Scientists call this wet deposition: the process by which falling rain collects and deposits atmospheric pollution onto surfaces below.
Between rainstorms, a second process called dry deposition adds even more material to the roof surface. Bird droppings, soot, pollen, and tiny rubber particles blown off nearby roads all settle quietly on the roof. When a storm finally hits, the first flush of runoff carries a disproportionately high load of these accumulated pollutants into the watershed.
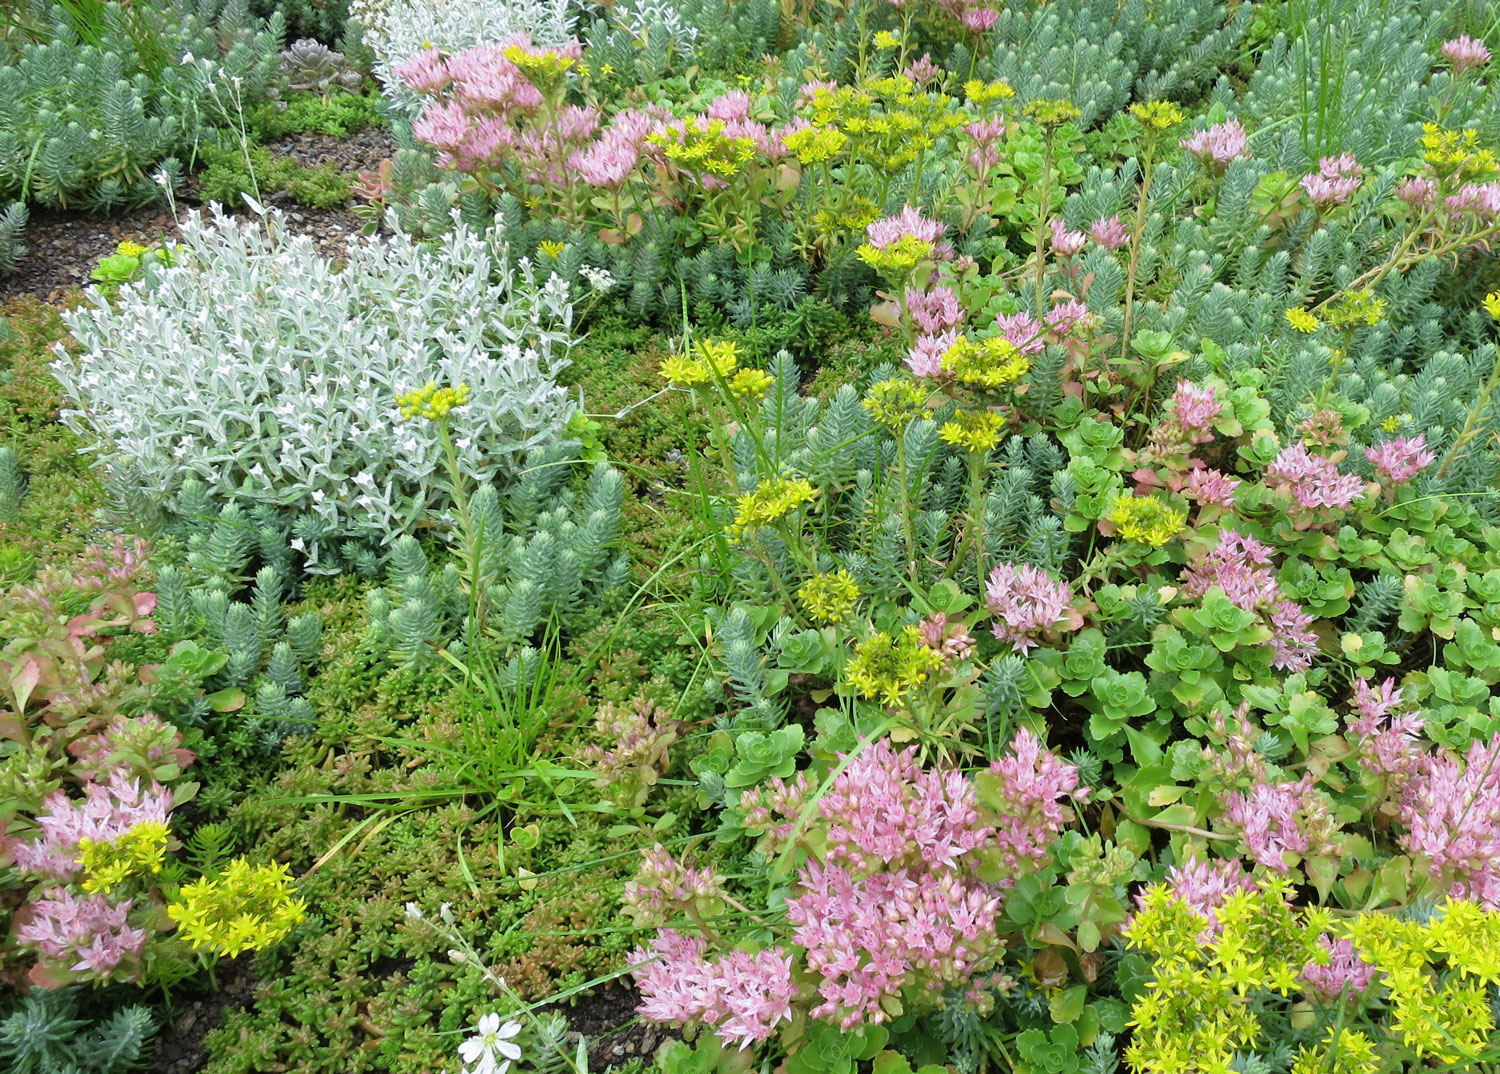
So where do the specific pollutants in this simulation come from? Nitrate and ammonium originate mainly from atmospheric deposition — nitrogen pollution dissolved into rain from urban air. Green roofs reduce these because roof plants absorb nitrogen for growth. Phosphorus on conventional roofs comes from dust and bird droppings baking onto the surface; green roofs actually contribute more phosphorus because it leaches out of the engineered growing media — essentially fertilized soil on top of the building. Magnesium and boron come almost entirely from green roof growing media, which contains mineral amendments that dissolve and wash away with each rainfall event.
All of this runoff eventually drains into Scajaquada Creek, which flows through Delaware Park and empties into the Niagara River. Scajaquada Creek already receives nitrogen and phosphorus from dozens of urban sources. In this simulation, you will investigate how changing the design of McKinley's roof — by expanding its green roof — affects the pollutant load entering that watershed during a single rainstorm.
| Pollutant | Green Roof Load | Conv. Roof Load | Combined Load | vs. All-Conv. Roof |
|---|
"vs. All-Conv. Roof" compares the combined load to what it would be if 100% conventional roof. Negative % = pollution reduction. Positive % = increase.
Chart shows pollutant loads in grams for green roof portion, conventional roof portion, and combined total.
Automatically run five scenarios (0%, 10%, 25%, 50%, 100% green coverage) using your current rainfall and roof area settings, and compare pollutant reduction vs. an all-conventional roof.